Sample Representativeness Analysis
An example scenario for conducting the representativeness analysis below:
Your meta-study of swidden agriculture in Tropical Woodlands has just been criticized as being seriously biased – “the case studies you chose are in the most accessible areas of Tropical Woodlands and do not represent the real global patterns of swidden agriculture, which are most common in the more remote areas of these woodlands.”
The editor requires you to provide evidence that this is not the case.
To meet the editor’s request, you would have to make several modifications to the default parameters to customize GLOBE’s representativeness analysis to the unique context of your selected case studies. These include filtering the global extent of your analysis and choosing the appropriate binning method given the global variable under consideration (i.e., ‘Accessibility‘).
Filtering
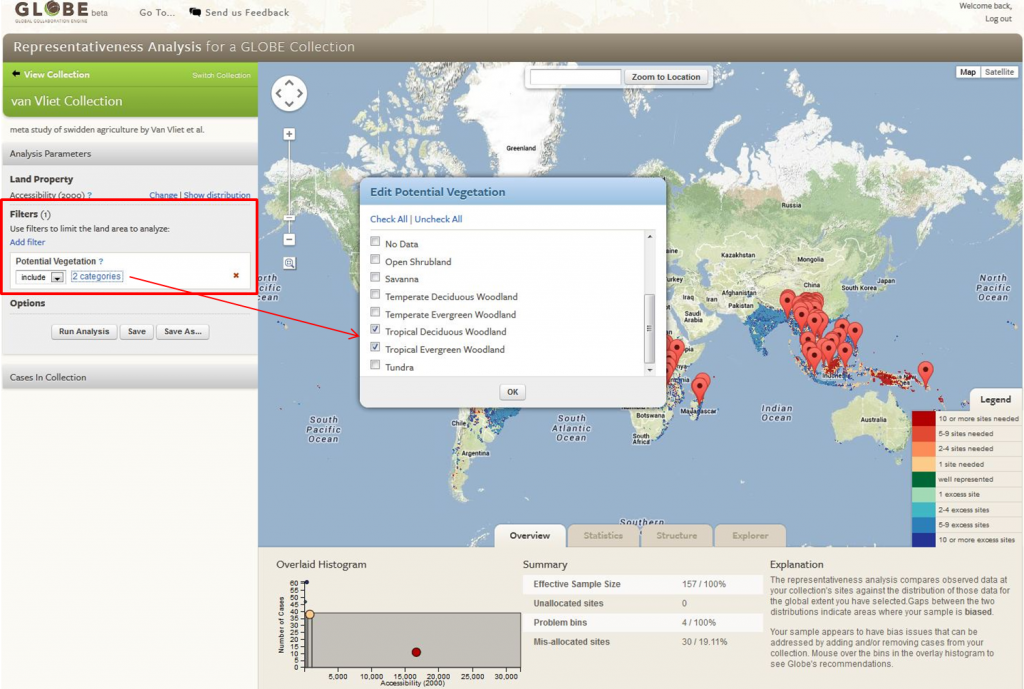
The default setting is to include the entire global extent in a representativeness analysis. However, since your meta-study is considering swidden agriculture in tropical woodlands, your case studies should not be expected to represent swidden agriculture occurring outside of tropical woodland biomes. To limit your analysis to these areas, select a variable under the ‘Filters’ tool, such as the ‘Potential Vegetation‘ for example, and select only the tropical biomes.
Binning
Because representativeness is based on the comparison between the distributions of the selected global variable within your collection of case studies and the global population of possible study sites, another consideration you need to make concerns the distribution of the global variable upon which your representativeness analysis will be based – in this case, ‘Accessibility‘. If the distribution of the global variable is highly skewed (e.g. many low values, few high values), then this must be accounted for when comparing variable distributions between your collection and population.
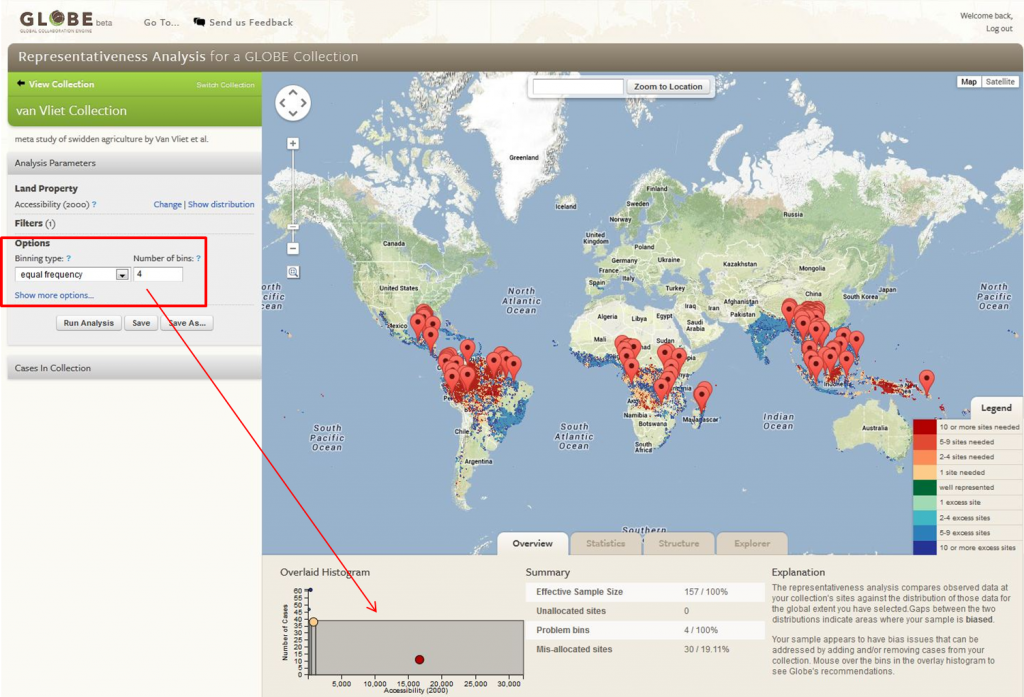
The default binning method uses three equal width bins. However, the ‘Accessibility‘ variable is not normally distributed with a large number of low values (highly accessible areas). To compensate for this, you should select an equal frequency binning method, which is a more precise means of comparing distributions of skewed variables. Under the ‘Options’ tool, select ‘equal frequency’ from the ‘Binning Type’ menu. Additionally, you can choose to increase the number of bins, which provides a more detailed description of which parts of the global variable distribution are under- or over-represented by you collection of case studies. Four bins have used in this example for simplicity, but a higher number would create a more detailed analysis.


