Representativeness Analysis
The following instructions describe the basic procedures for conducting a Representativeness Analysis in GLOBE and help answer these basic questions:
“Is my collection of case studies an unbiased sample, or is it significantly biased?” and “How can it be improved?”.
Representativeness Analysis Step-by-step:
- Begin a New Representativeness Analysis from the GLOBE Home Dashboard.

- Select a Collection of case studies to serve as the sample. Alternatively, create a new collection of cases by first selecting “Create a New Collection” under “My Collections” on the GLOBE Home Dashboard.

- Choose a Filter to specify the global extent that the sample should represent (e.g. tropical woodlands, population density < 10 persons km-2). More than one filter may be selected for analysis.

- Select a Land Variable that the collection (sample) should represent. For example, if the collection should cover the patterns of population density within tropical woodlands, choose population density as the land variable. [note: at this time, representativeness analysis can be conducted on one land variable at a time; multivariate representativeness analysis is planned for a future release of GLOBE.

- Stratify the Land Variable into Bins. Land variables must be divided (stratified) into bins before GLOBE can determine how well the cases in a collection cover the patterns of a land variable.

- Continuous variables (like temperature, population density) are automatically stratified into 5 Equal Frequency bins, corresponding to 5 equal areas of Earth’s land within the filtered extent (analogous to Stratified Sampling by Proportionate Allocation). The number of bins can be altered at will using the click box.
- GLOBE automatically divides categorical/discrete variables (like biomes, soil types) using the categories themselves.
- Optional: select an alternative strategy for dividing the variable into bins (strata), including the number of bins. Additional information on Binning Types can be found by hovering over the blue question mark tool tips and on the Binning Documentation Page.
- NOTE that any bin for which the land variable has no data cannot be analyzed statistically.
- Run the Representativeness Analysis. Results are presented in the map, and under the different tabs: Overview, Statistics, Structure, Search, and Explorer.
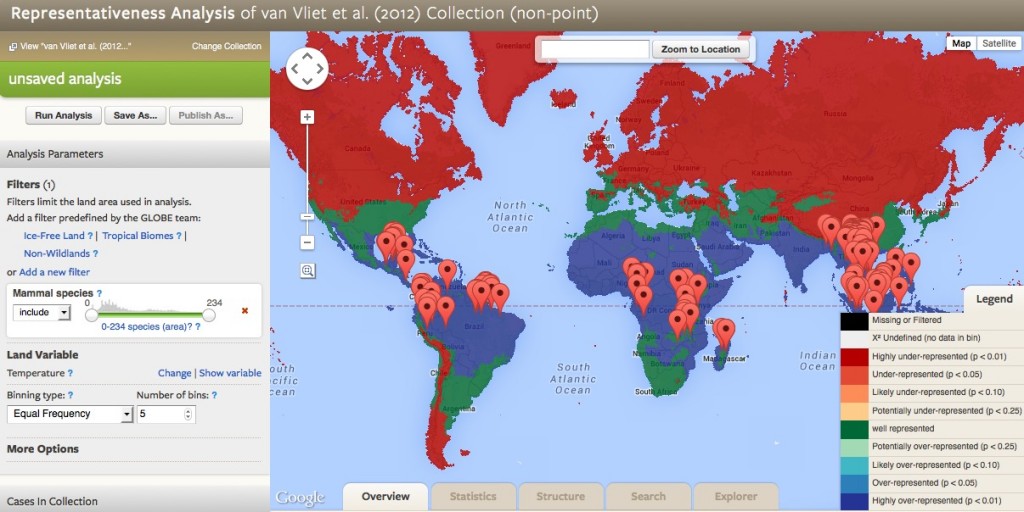
- Interpret the map. Areas that are well represented by the sample are highlighted in green (case studies present at expected frequencies), underrepresented areas in red (case studies less frequent than expected) and overrepresented areas in blue (case studies more frequent than expected at random). Refer to the Legend for full coloring scheme.
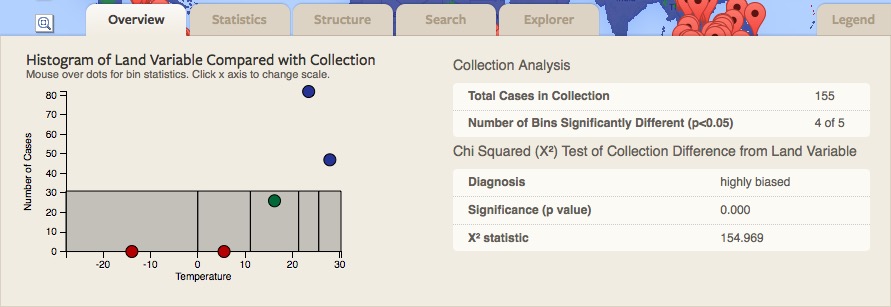
- Explore the Overview Tab. In the Histogram of Land Variable Compared with Collection in the Overview tab, the number of bars corresponds to the number of bins selected in Step 6. Grey bars indicate the frequency distribution of a random sample; colored circles correspond to the frequency distribution of the selected collection. Red circles indicate underrepresentation, blue indicates overrepresentation, and green indicates well-represented bins. Clicking on the bins will adjust scaling of the x-axis, and hovering over circles provides statistical information for the sample of the corresponding bin. A representativeness statistic (p-value) ranging from 0 to 1 (higher is better) is presented for the selected collection (sample), together with the probability that it is more representative than a random sample; values above 0.5 indicates randomness (lack of bias), probabilities below 0.25 indicate increasing levels of bias. Well-represented, underrepresented and overrepresented areas are quantified in km2 and as a percentage of the specified global extent.
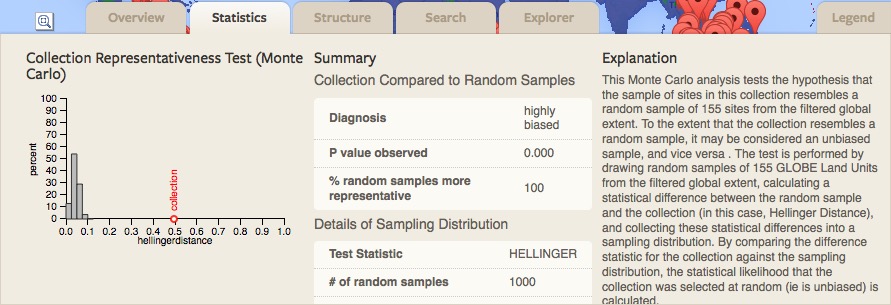
- Explore the Statistics Tab. The Statistics Tab provides more detailed statistical analyses of the Representativeness Analysis. The Collection Representativeness Test (Monte Carlo analysis) tests the hypothesis that a collection could have been chosen without bias from a reference distribution. In this case, the reference distribution (population) is the set of unfiltered GLUs. The test is performed by drawing random samples of GLUs from the population, each of the effective sample size, calculating a statistic, and collecting those statistics into a sampling distribution. The statistic for the collection can then be compared against the sampling distribution to determine the likelihood that its value would occur if the collection were selected in an unbiased (random) manner. The histogram shows the sampling distribution of Hellinger Distance for random samples (gray bars) versus the collection statistic. The accompanying table summarizes the sampling distribution and bias-related statistics.
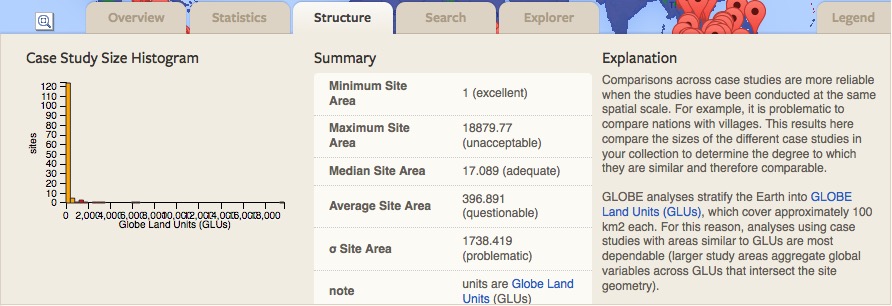
- Explore the Structure Tab. The Case Study Size Histogram under the structure tab provides information about the size of cases included in the Representativeness Analysis. Comparisons across case studies are more reliable when the studies have been conducted at the same spatial scale. For example, it is problematic to compare nations with villages. This results in this tab compare the sizes of the different case studies in your collection to determine the degree to which they are similar and therefore comparable.
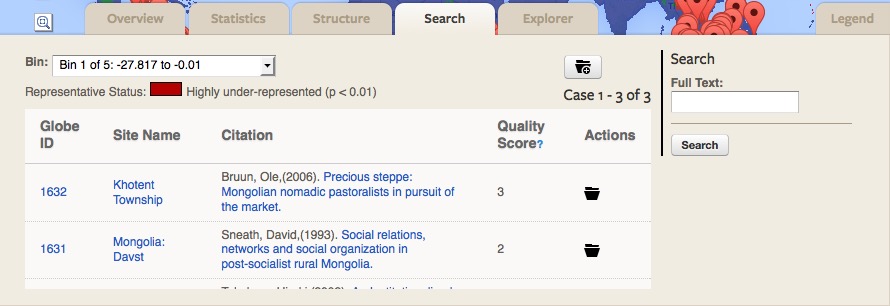
- Explore the Search Tab. Based on the results of the Representativeness Analysis, the Search tab provides a list of existing case studies in GLOBE that may be incorporated into the collection in order to improve representativeness. Cases are selected based on their geographic location in relation to the global variable; therefore, suggested cases may not be relevant to the collection. The search bar in the right column allows for full text searching within the recommended cases listed by GLOBE.
- Explore the Explorer Tab. For more advanced visualizations of the Representativeness Analysis, see the Explorer tab.
- If unsatisfied with your results, rerun the analysis, changing the specified extent and/or variables.
- Save the Representativeness Analysis by clicking “Save As…”. The analysis must then be named and can be shared and/or resumed.
- Publish the Representativeness Analysis. The analysis is saved in a permanent (unalterable) format (Representativeness Analysis Report) serving as the document of record that can be shared in a citable format (permalink) or printed as a .pdf for inclusion as a supplement in published work. You may also create a unique DOI to cite your report by clicking the DOI icon in the top right corner.
Additional Analysis using Case Weights. An excel file of case weights can be downloaded by clicking the appropriate icon in the top right corner on the published report page. The file will provide a list of all case studies in the collection, values of each global variable for those cases, as well as a weight value for each case. Weights are calculated based on results of the representativeness analysis, and may be used by metastudy researchers to decrease the amount of bias in their work. Weight values may be multiplied with data associated to each case, thereby increasing or decreasing the data’s relative importance in calculations, and thus effectively reducing bias in the data of the collection.
References:
GLOBE Representativeness Methods Paper

